available 24/7
Free Consultation

Posted on July 6, 2023 in Drug Crimes,News
Drug trafficking is a serious crime that is highly prevalent in the United States. It is a complex and criminal enterprise that involves the manufacturing, distribution, and sale of illegal drugs – such as heroin, fentanyl, cocaine, methamphetamine, marijuana, and others. In recent years, drug trafficking has become a major concern for law enforcement agencies as approximately 61.2 million Americans aged 12 and older used illicit drugs in 2021. It is a widespread issue, and the impact of drug trafficking can be felt across the United States
Drug trafficking and drug possession are two distinct criminal offenses.
For decades the United States has been dealing with drug trafficking, and the US is deeply affected by the crime and violence created by transnational criminal organizations – including the cartel from Mexico. The illegal drug trade is a multi-billion dollar industry that brings with it numerous consequences, including addiction, violence, and economic instability.
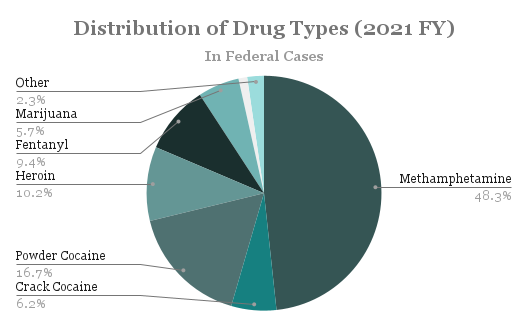
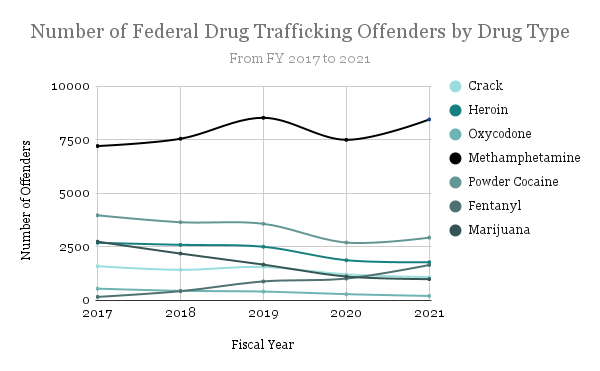
In 2021, investigations into the 17,520 drug trafficking offenses that happened in the United States found that 7 drug types were responsible for 97.8% of drug trafficking offenses. The 7 drug types include methamphetamine, powder cocaine, crack cocaine, heroin, fentanyl, marijuana, and oxycodone.
The breakdown of the distribution of drug types can be found below:
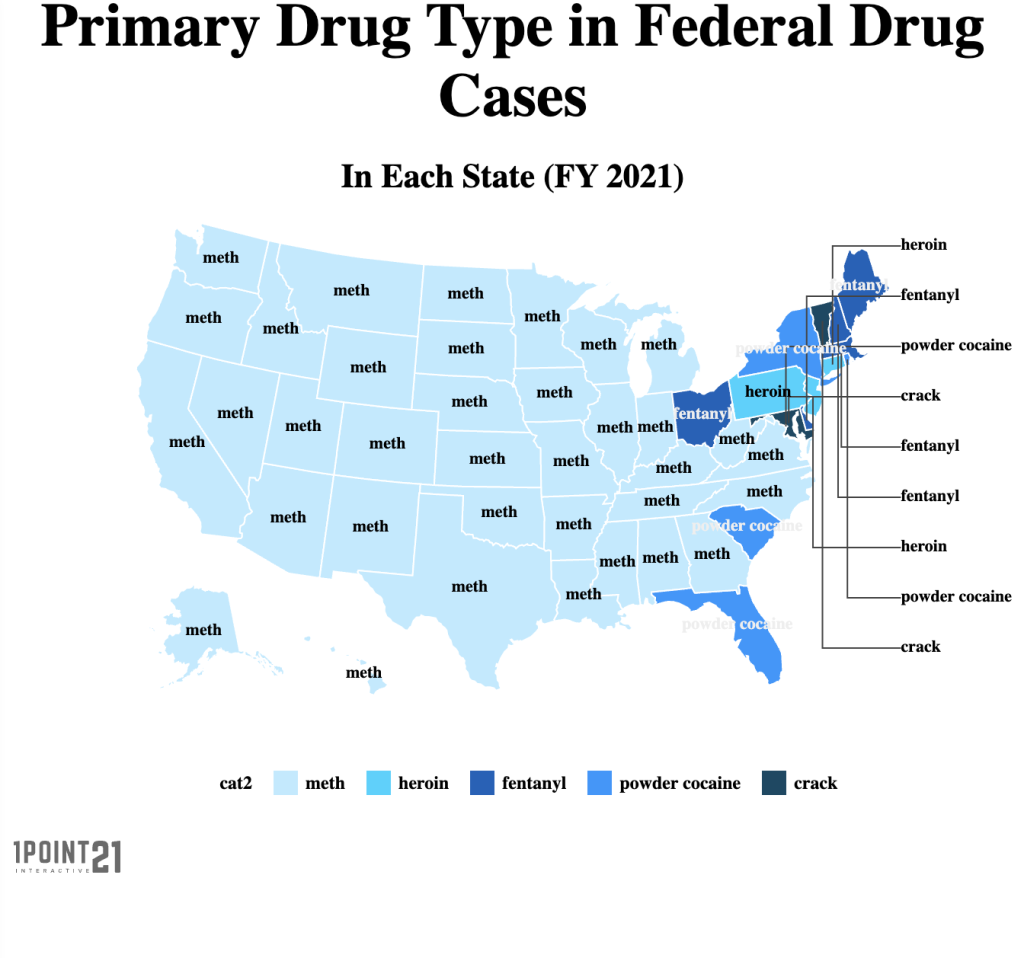
Further investigation into the drug trafficking data for 2021 revealed the most commonly trafficked drug in the United States is methamphetamine. However, along the east coast fentanyl, crack, heroin, and cocaine are also prevalent. The map below demonstrates the primary drug type in federal drug trafficking cases in each state.
The United States classifies different drugs into five different schedules based on their potential for abuse and dependency, and their accepted medical uses. The classification system is known as the Controlled Substances Act (CSA) and was passed by Congress in 1970. The classification of a drug into a particular schedule is determined by the Drug Enforcement Administration (DEA) based on different factors, including its potential for abuse, pharmacological effects, and scientific evidence of its medical benefits.
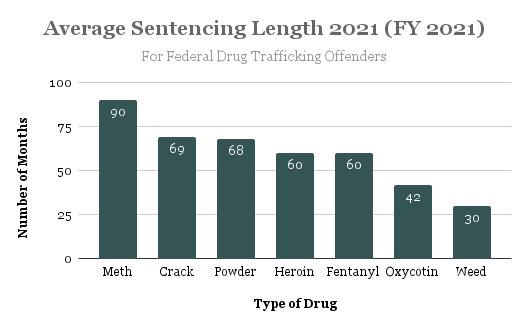
The average sentence length for federal drug trafficking offenders in 2021 was 74 months, but this varied depending on the type of drug being trafficked. The breakdown of the average sentencing length for each drug type can be found in the infographic below. Out of the drug trafficking offenders convicted of a federal crime:
Drug trafficking is a problem across the United States. Data from 2021 displays that the districts with the most federal drug trafficking offenders are all located along the southern half of the United States, as the bulk of drugs trafficked into the U.S. come from Mexico. The following districts (which are different from states) had the highest number of federal drug trafficking offenders in 2021:
As demonstrated by the map below, Texas and California have the highest total number of federal drug traffickers due to their large populations and proximity to the border. Other states with a high number of drug federal drug trafficking offenders are: Florida, New York, North Carolina, Arizona, Tennessee, Missouri, Ohio, and Pennsylvania.
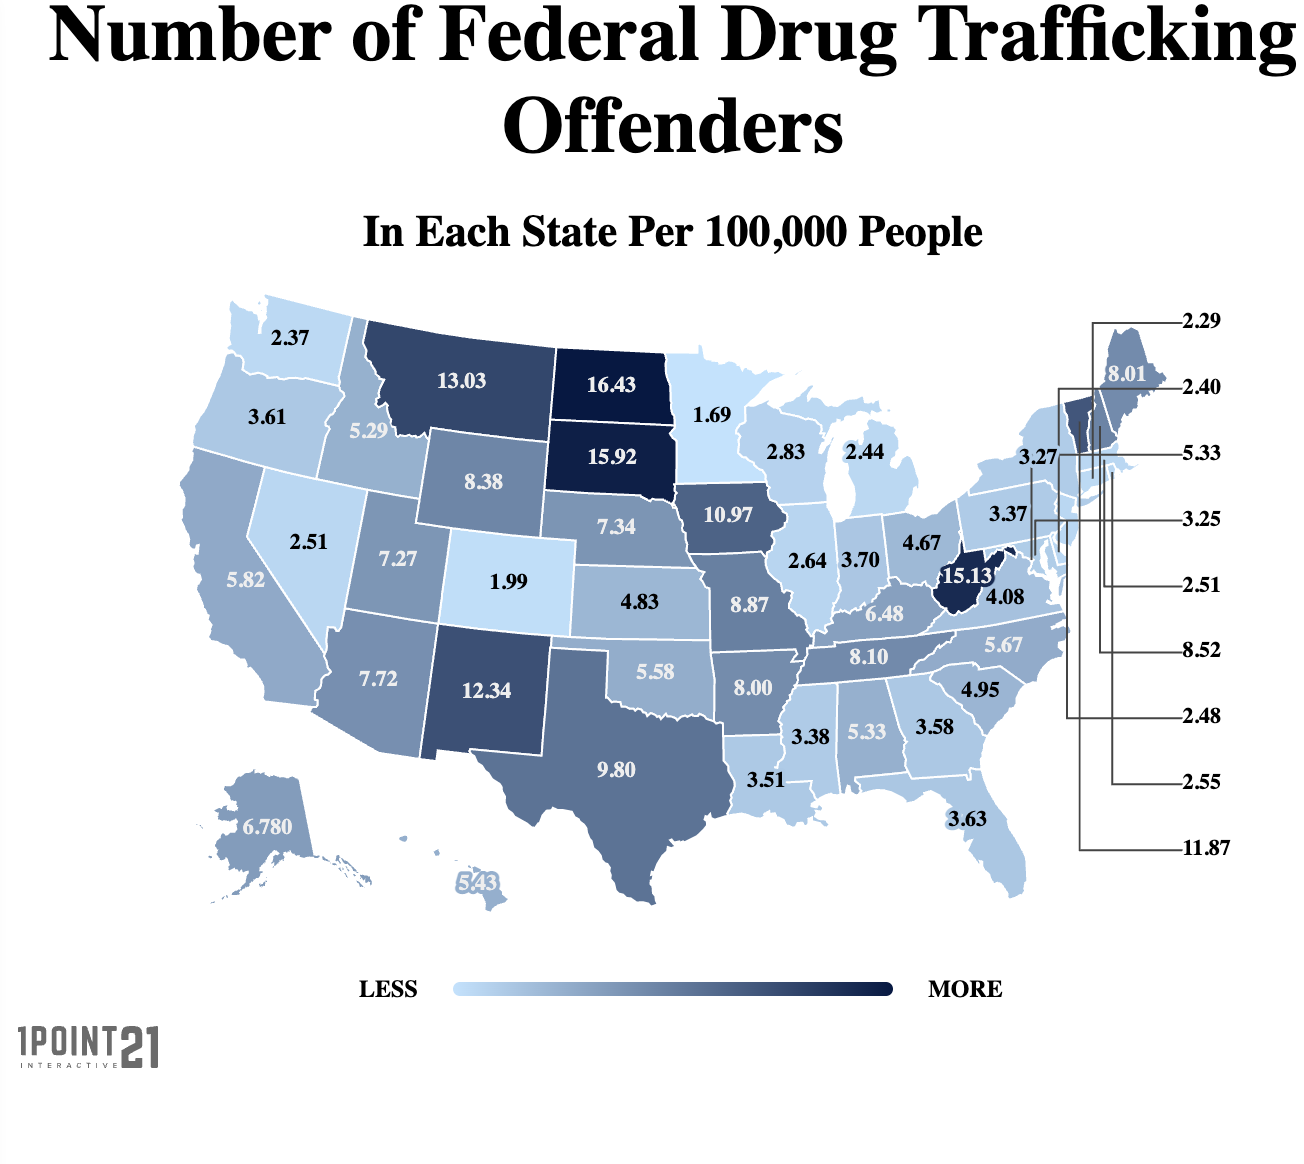
If state population is taken into account, the states with the highest number of drug trafficking offenders per 100,000 people are: North Dakota, South Dakota, West Virginia, Montana, New Mexico, Vermont, Iowa, Texas, Missouri, and New Hampshire.
| State | State Population | Number of Federal Drug Trafficking Offenders | # of Federal Drug Trafficking Offenders (in each state) Per 100,000 People |
|---|---|---|---|
| Alabama | 5,024,279 | 268 | 5.334 |
| Alaska | 737,438 | 50 | 6.78 |
| Arizona | 7,529,767 | 581 | 7.716 |
| Arkansas | 3,011,524 | 241 | 8.003 |
| California | 39,538,223 | 2,303 | 5.825 |
| Colorado | 5,987,979 | 119 | 1.987 |
| Connecticut | 5,987,979 | 137 | 2.288 |
| Delaware | 1,001,149 | 24 | 2.397 |
| DC | 712,816 | 38 | 5.331 |
| Florida | 21,944,577 | 796 | 3.627 |
| Georgia | 10,711,908 | 383 | 3.575 |
| Hawaii | 1,455,271 | 79 | 5.429 |
| Idaho | 1,853,746 | 98 | 5.287 |
| Illinois | 12,689,334 | 335 | 2.64 |
| Indiana | 6,785,528 | 251 | 3.699 |
| Iowa | 3,190,369 | 350 | 10.971 |
| Kansas | 2,937,880 | 142 | 4.833 |
| Kentucky | 4,505,836 | 292 | 6.48 |
| Louisiana | 4,667,990 | 164 | 3.513 |
| Maine | 1,361,574 | 109 | 8.005 |
| Maryland | 6,177,224 | 201 | 3.254 |
| Massachusetts | 7,120,804 | 179 | 2.514 |
| Michigan | 10,084,442 | 246 | 2.439 |
| Minnesota | 5,696,424 | 96 | 1.685 |
| Mississippi | 2,961,279 | 100 | 3.377 |
| Missouri | 6,164,195 | 547 | 8.874 |
| Montana | 1,090,095 | 142 | 13.026 |
| Nebraska | 1,961,504 | 144 | 7.341 |
| Nevada | 3,143,335 | 79 | 2.513 |
| New Hampshire | 1,384,742 | 118 | 8.521 |
| New Jersey | 9,288,994 | 230 | 2.476 |
| New Mexico | 2,106,361 | 260 | 12.344 |
| New York | 20,215,751 | 661 | 3.27 |
| North Carolina | 10,801,845 | 613 | 5.675 |
| North Dakota | 779,094 | 128 | 16.429 |
| Ohio | 11,703,668 | 546 | 4.665 |
| Oklahoma | 3,981,782 | 222 | 5.575 |
| Oregon | 4,268,055 | 154 | 3.608 |
| Pennsylvania | 13,011,844 | 438 | 3.366 |
| Rhode Island | 1,097,408 | 28 | 2.551 |
| South Carolina | 5,251,276 | 260 | 4.951 |
| South Dakota | 898,332 | 143 | 15.918 |
| Tennessee | 6,949,421 | 563 | 8.101 |
| Texas | 29,768,737 | 2,917 | 9.799 |
| Utah | 3,356,635 | 244 | 7.269 |
| Vermont | 623,347 | 74 | 11.871 |
| Virginia | 8,631,393 | 352 | 4.078 |
| Washington | 7,769,097 | 184 | 2.368 |
| West Virginia | 1,784,787 | 270 | 15.128 |
| Wisconsin | 5,893,718 | 167 | 2.834 |
| Wyoming | 572,884 | 48 | 8.379 |
Between the years 2017 and 2021 data demonstrates the following:
While every drug trafficker is different, law enforcement officials found the following demographics were common among federal drug trafficking offenders:
82.2% of drug trafficking offenders were men.
The race distribution among federal drug traffickers:
Sentences were increased for:
Sentences were decreased for:
This study was conducted using data primarily from the United States Sentencing Commission on federal drug trafficking offenders in the fiscal year 2021.
If you would like to utilize any of the images, findings, or data in this study for a report or republishing purposes, please link to this page to provide credit. If you would like to schedule a consultation to speak with a Phoenix drug crimes lawyer, please contact our firm today.
Sources: